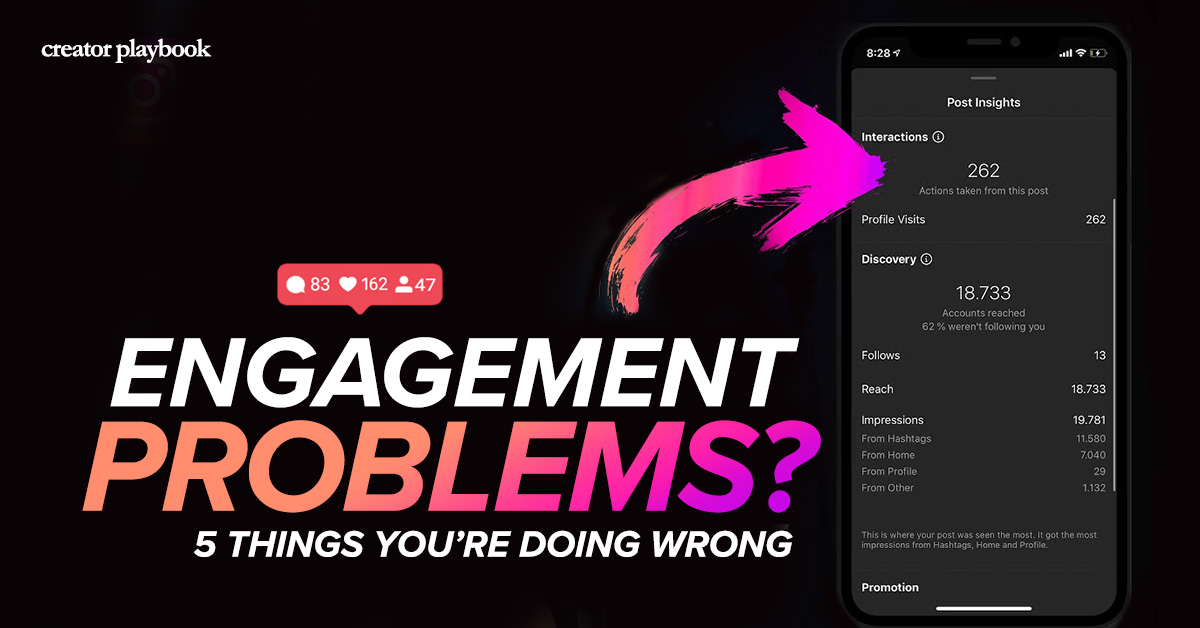
I analyzed 100k Instagram posts – Here’s why your engagement is stuck (and how to fix it)
I’ve come across a ridiculously simple concept that made the engagement on my content explode.
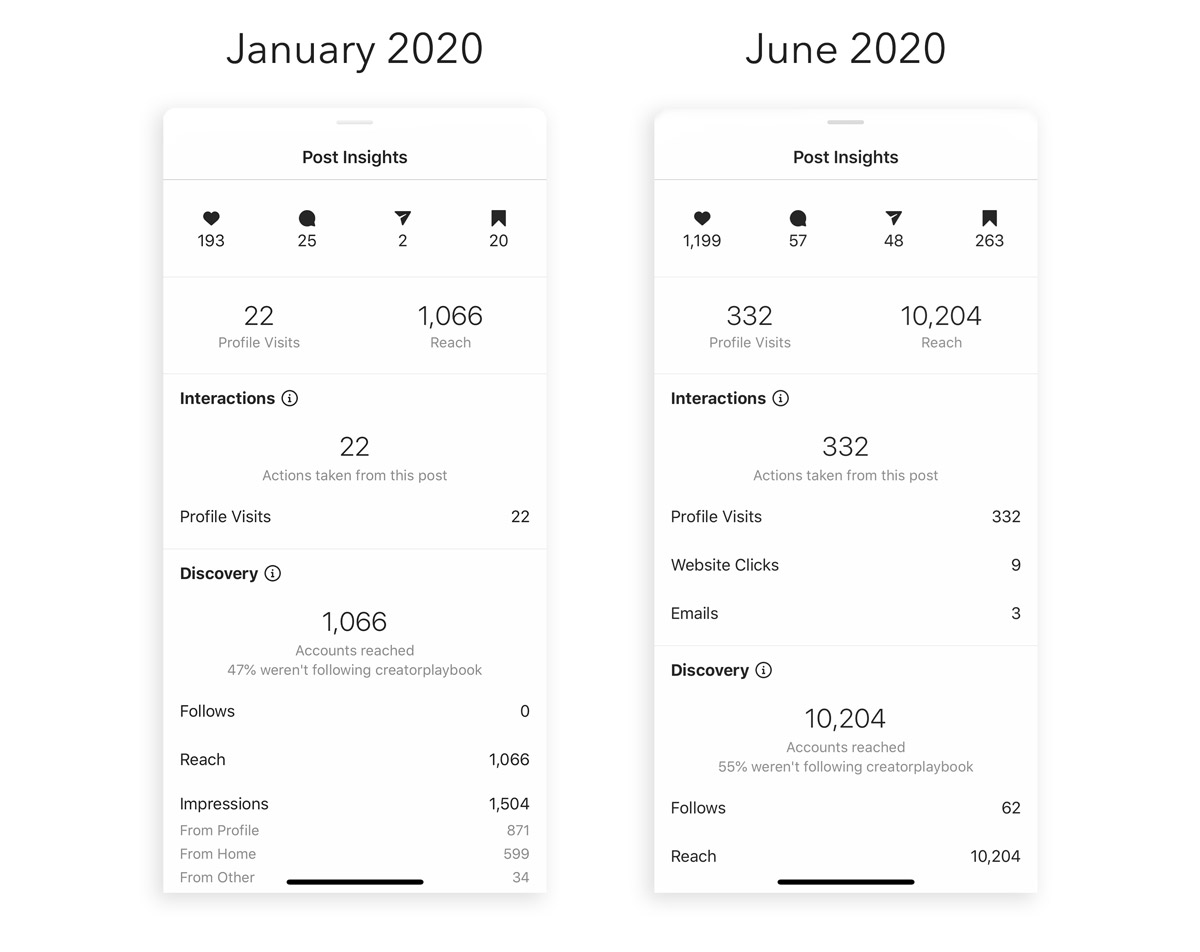
The screenshots below are the results.
. Step 1 – Make a List of 5 Competitors
You should already have a pretty good idea of the accounts that are similar to yours. They can be direct competitors, or even just people who have a similar audience to you.
Add them into an Excel spreadsheet, and open their Instagram profiles in your web browser.
. Step 2 – Track the Engagement Metrics
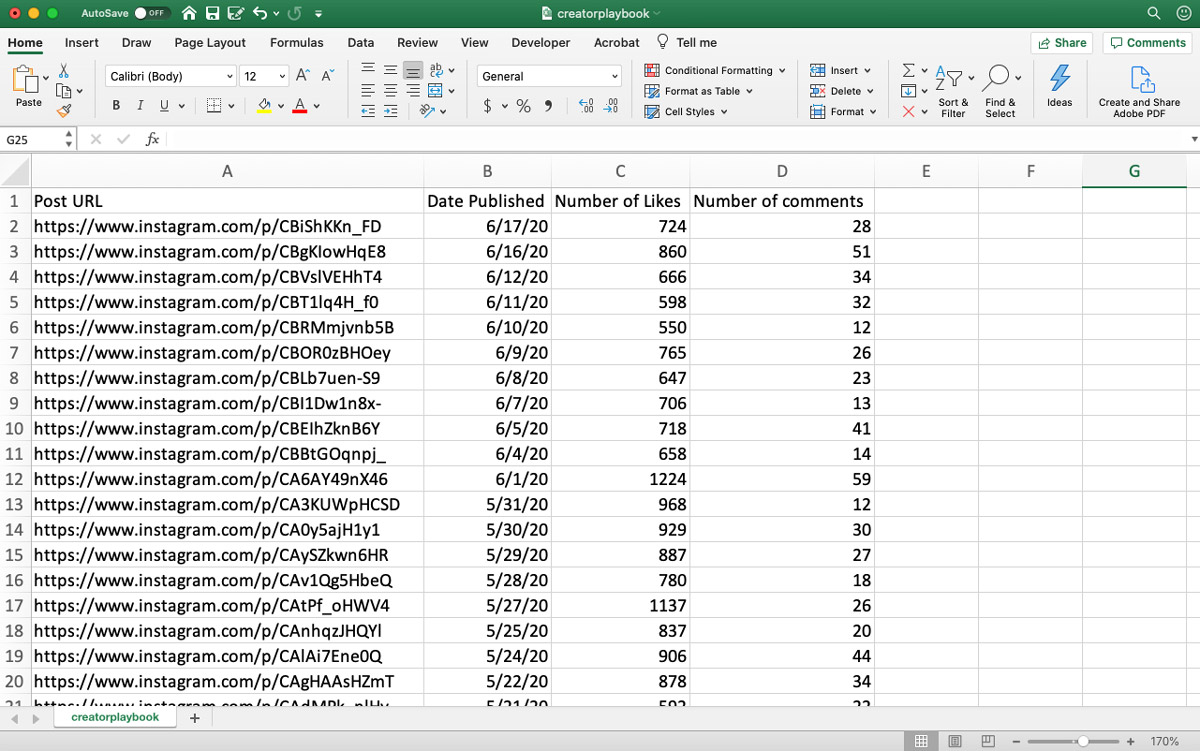
Create 4 columns in your spreadsheet for each competitor:
URL | Date Published | Likes | Comments
Go through each post and add the respective link and numbers for each of their posts. Your spreadsheet should start to look like this:
. Step 2.5 – Shortcut! Automate Your Research
If you want to do this faster, just use the our Google Chrome plugin to download a report of every single post on your competitor’s profile.
. Step 3 – Look for the Outliers
You’ll notice that the number of likes on their posts will look something like: 100, 110, 105, 436, 100. That post with 436 likes is what you want to inspect further.
A quick way to identify these outliers is to sort your spreadsheet from Most Likes to Least Likes.
. Step 4 – Reverse-Engineer the Success
The hardest part about creating content is that you feel like you’re mostly throwing things at the wall to see what sticks. This process shows you exactly what worked for accounts with a similar audience.
Take a minute to study the nuances of these posts, and use that as inspiration to create new content of your own.
. Step 5 – Trigger the Algorithm
Instagram puts such a big emphasis on engagement. If your post has a high engagement rate, it triggers the algorithm to show it to a higher percentage of your followers.
When you hit that tipping point, it becomes a snowball effect.
Your likes and comments will increase exponentially, so the post will start to rank higher on hashtags. That exposes your content to new people, and success there will trigger your post to appear in Explore feeds.
Bonus Side Effect: More Followers. If the first 9 posts in your grid are strong, the percentage of profile viewers (from hashtags, explore feed, etc.) that convert to followers will dramatically increase.
Just look at my screenshots above – I got 62 new followers from just that one post.
. Step 6 – Refine & Optimize
If you’re looking to optimize this strategy further, there are two giant levers that you can pull: increase the amount of data you study, and decrease the time it takes to research.
I started out by hiring a virtual assistant to do this research for me, but that got costly after a few months. That’s when I decided to build this Google Chrome plugin. You can just download a report on every profile you want.
I hope this method is helpful to you, and look forward to seeing your results. Feel free to drop me a DM on Instagram if you have any questions.
Until next time!
Adam
. Resources
Analyzer Plugin: www.creatorplaybook.com/simple-analytics
Find me on Instagram: www.instagram.com/creatorplaybook
Powerful lessons from the world's biggest creators, straight to your inbox.
Your favorite creatives break down their playbooks for success, along with the tools & tactics that you can apply.
Join 15k+ people who read Creator Playbook
Work smarter. Hustle harder.
The Playbook
Delivered each Sunday, we curate actionable advice from interviews, videos & more.
Live Q&A's
Get exclusive access to live Q&A's with your favorite creators.